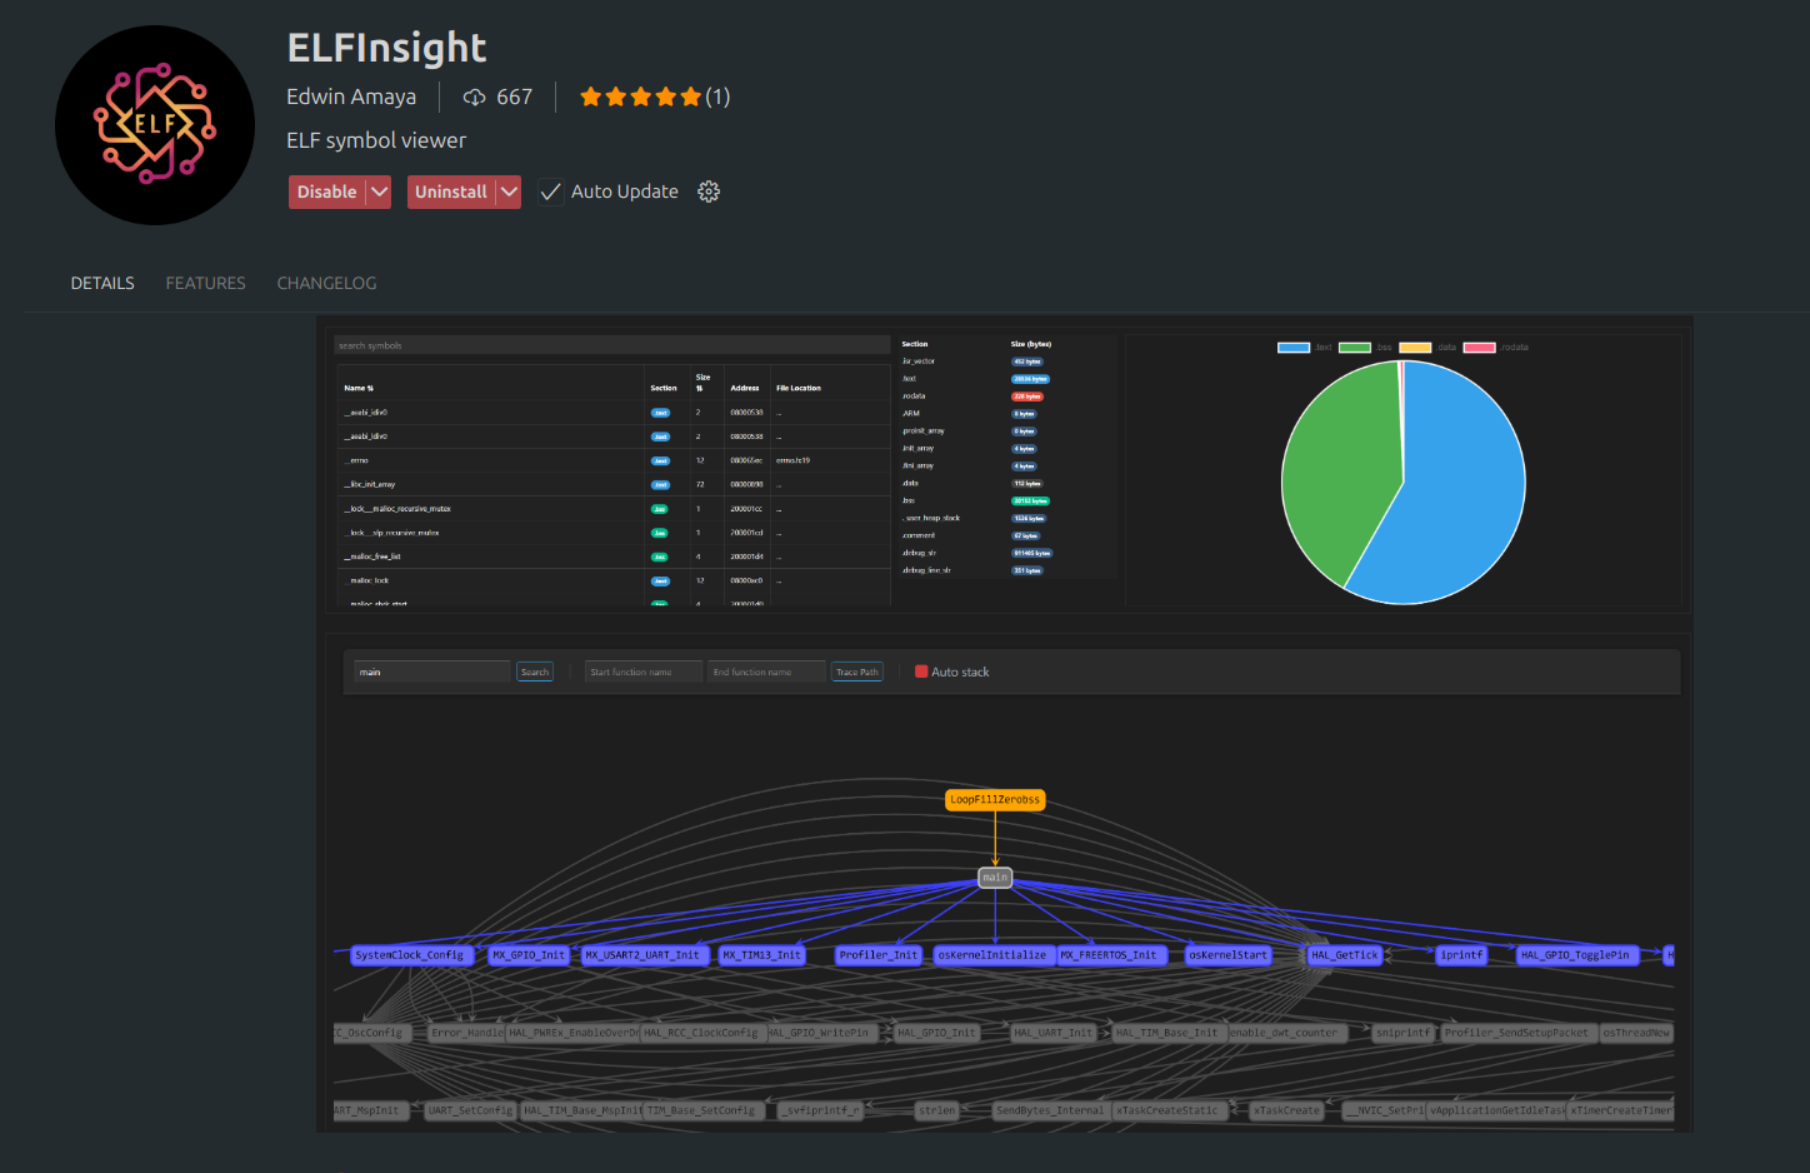
My VS Code extension : ELFInsight
VS Code Extension : ElfInsight
Build analyzer and call-graph generator with path tracing capabilities for compiled ARM Cortex-M binaries
Live on themarketplace
Wrestling Bytes: A Firmware Engineer’s Quest for Smaller Code
Ever feel like you’re squeezing firmware into a too-tight container? I’ve been there. Back at Analog Devices, after the Maxim acquisition, I was the go-to microcontroller/BLE whisperer for a particularly high-end but cost-conscious client. Let me tell you, they were obsessed with code size. Fast forward to my time at ST, and surprise! Code size is still a hot topic. Tweaking build settings and optimization flags is the usual approach, but I prefer digging into the power of ARM GNU tools. My secret weapon? arm-none-eabi-nm. This little command-line gem unveils the secrets of your binary’s symbol table, including the size of each function and variable. Knowing where your biggest code hogs are hiding is half the battle.
Headsup, this is not a writeup on how to decrease code size. Im simply shatring my experience while creating a tool to help me analyze symbols.
arm-none-eabi-nm --size-sort --reverse-sort --print-size --radix=d --size-sort --defined-only --demangle <your_binary>.elf
What do the args mean:
--size-sort: Sorts the output by the size of the symbols. (small to large)--reverse-sort: Sorts the output in reverse order. (large to small)--print-size: Prints the size of each symbol.--radix=d: Displays sizes in decimal format.--defined-only: Shows only defined symbols (not undefined or weak symbols).--demangle: Demangles C++ symbols to make them more readable.<your_binary>.elf: The ELF file you want to analyze.
ELFInsight: A VS Code Extension is Born
So, how could I make this size-sleuthing easier for everyone? Most IDEs (like the various Eclipse flavors) have build analyzers and a button for just about everything, thus a lot of modern engineers are not well versed with the ARM GNU tools or the command line. I wanted to create a tool that would make it easy for anyone to analyze their code size without needing to be a command-line ninja. I couldn’t find anything comparable to eclipse offerings for VS Code, at least not with the level of detail I wanted. Thus, ELFInsight was born! This VS Code extension gives you a deep dive into ARM ELF files, making identifying the memory hogs a breeze (or at least less of a headache). It’s still a work in progress, but I wanted to share the journey.
Features
My initial goal was a simple, sortable, searchable table visualizing the symbol table, along with a summary of section sizes. Pretty standard stuff. Then, inspiration struck (or maybe it was just staring at empty space in the GUI). I added a call graph! This turned out to be the most challenging and rewarding part of the project. It’s a visual representation of your code’s function calls – nodes represent functions, and edges show the connections between them.
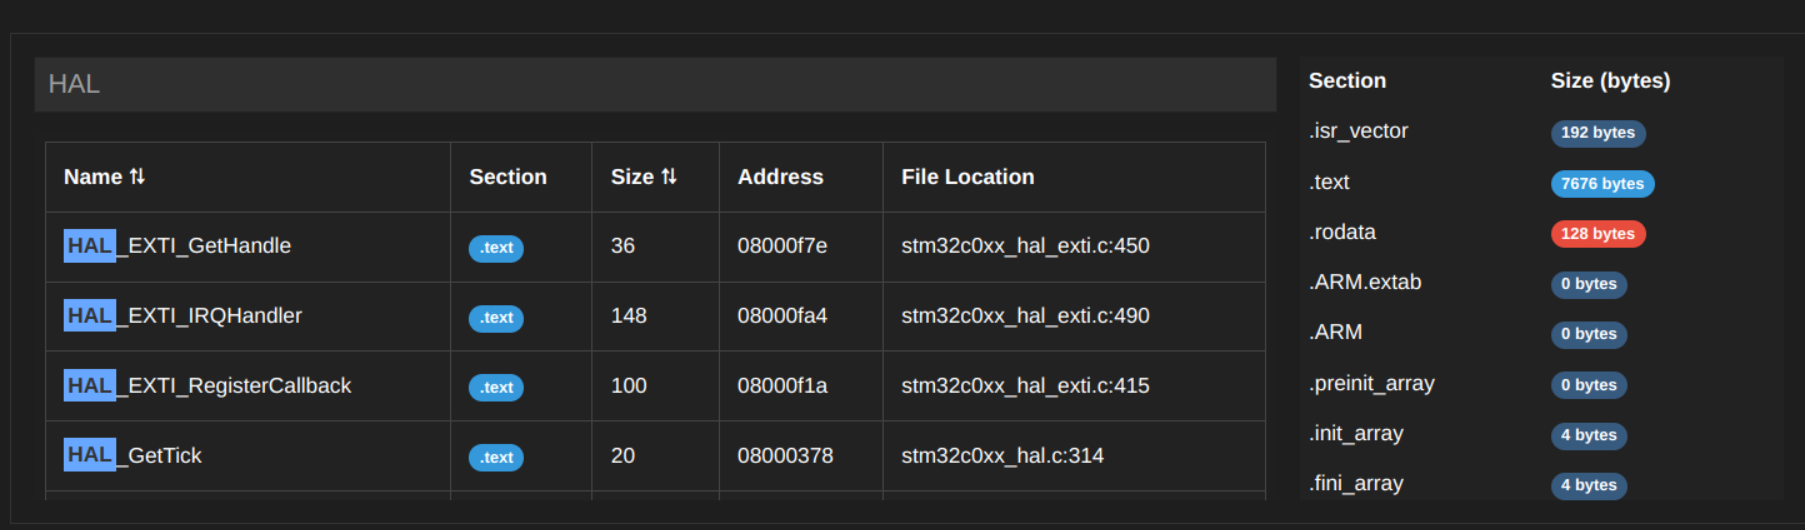
The symbol table and section sizes
The table was the simpler part. I used the arm-none-eabi-nm command to extract the symbol table from the ELF file. The output is parsed and displayed in a table format, with columns for the symbol name, size, and type. The table is sortable and searchable, making it easy to find specific symbols or sort by size.
// Function to load symbols from the selected ELF file
export async function loadElfSymbols(elfFilePath: string, panel: vscode.WebviewPanel) {
    try {
        // Use the execCommandWithStream to run the nm command
        const nmOutput = await execCommandWithStream(nmCommand, ['-S', '-l','--demangle', elfFilePath]);

        // Process the accumulated nmOutput by passing it to parseElfSymbols
        const symbols = await parseElfSymbols(nmOutput, panel, elfFilePath);

        // You can do additional operations with the symbols if needed
    } catch (error) {
        vscode.window.showErrorMessage(`Error: ${error}`);
    }
}
One issue I faced that I did not discover until actually using my own extension was that it could not handle really large ELF files. During development I was using the same small binary for testing, so I never encountered this issue. When I tried to load a larger ELF file, the extension would crash. I would get a cryptic error about buffer or something realted to size. This was happening because I was parsing the output directly from stdout. I had to change the code to pipe the output to a buffer and then parse it after the process had completed. This way, I could handle larger outputs without running into buffer size issues.
function execCommandWithStream(command: string, args: string[]): Promise<string> {
    return new Promise((resolve, reject) => {
        // Retrieve the ARM binaries path from the settings
        const config = vscode.workspace.getConfiguration('elfinsight');
        const armBinariesPath = config.get('armBinariesPath') as string;

         // Prepend the ARM binaries path to the command, if the path is set
         const fullCommandPath = armBinariesPath ? `${armBinariesPath}/${command}` : command;

        // Spawn the process with 'pipe' to ensure incremental handling
        const process = spawn(fullCommandPath, args, { stdio: ['pipe', 'pipe', 'pipe'] });

        let output = '';  // Buffer to accumulate output

        process.stdout.on('data', (data: Buffer) => {
            const chunk = data.toString();  // Convert the binary buffer to a string
            output += chunk;  // Append each chunk to the accumulated output
        });

        process.stderr.on('data', (data: Buffer) => {
            reject(`Error: ${data}`);
        });

        process.on('close', (code: number) => {
            if (code === 0) {
                resolve(output);  // Resolve the promise with the accumulated output
            } else {
                reject(`${command} process exited with code ${code}`);
            }
        });
    });
}
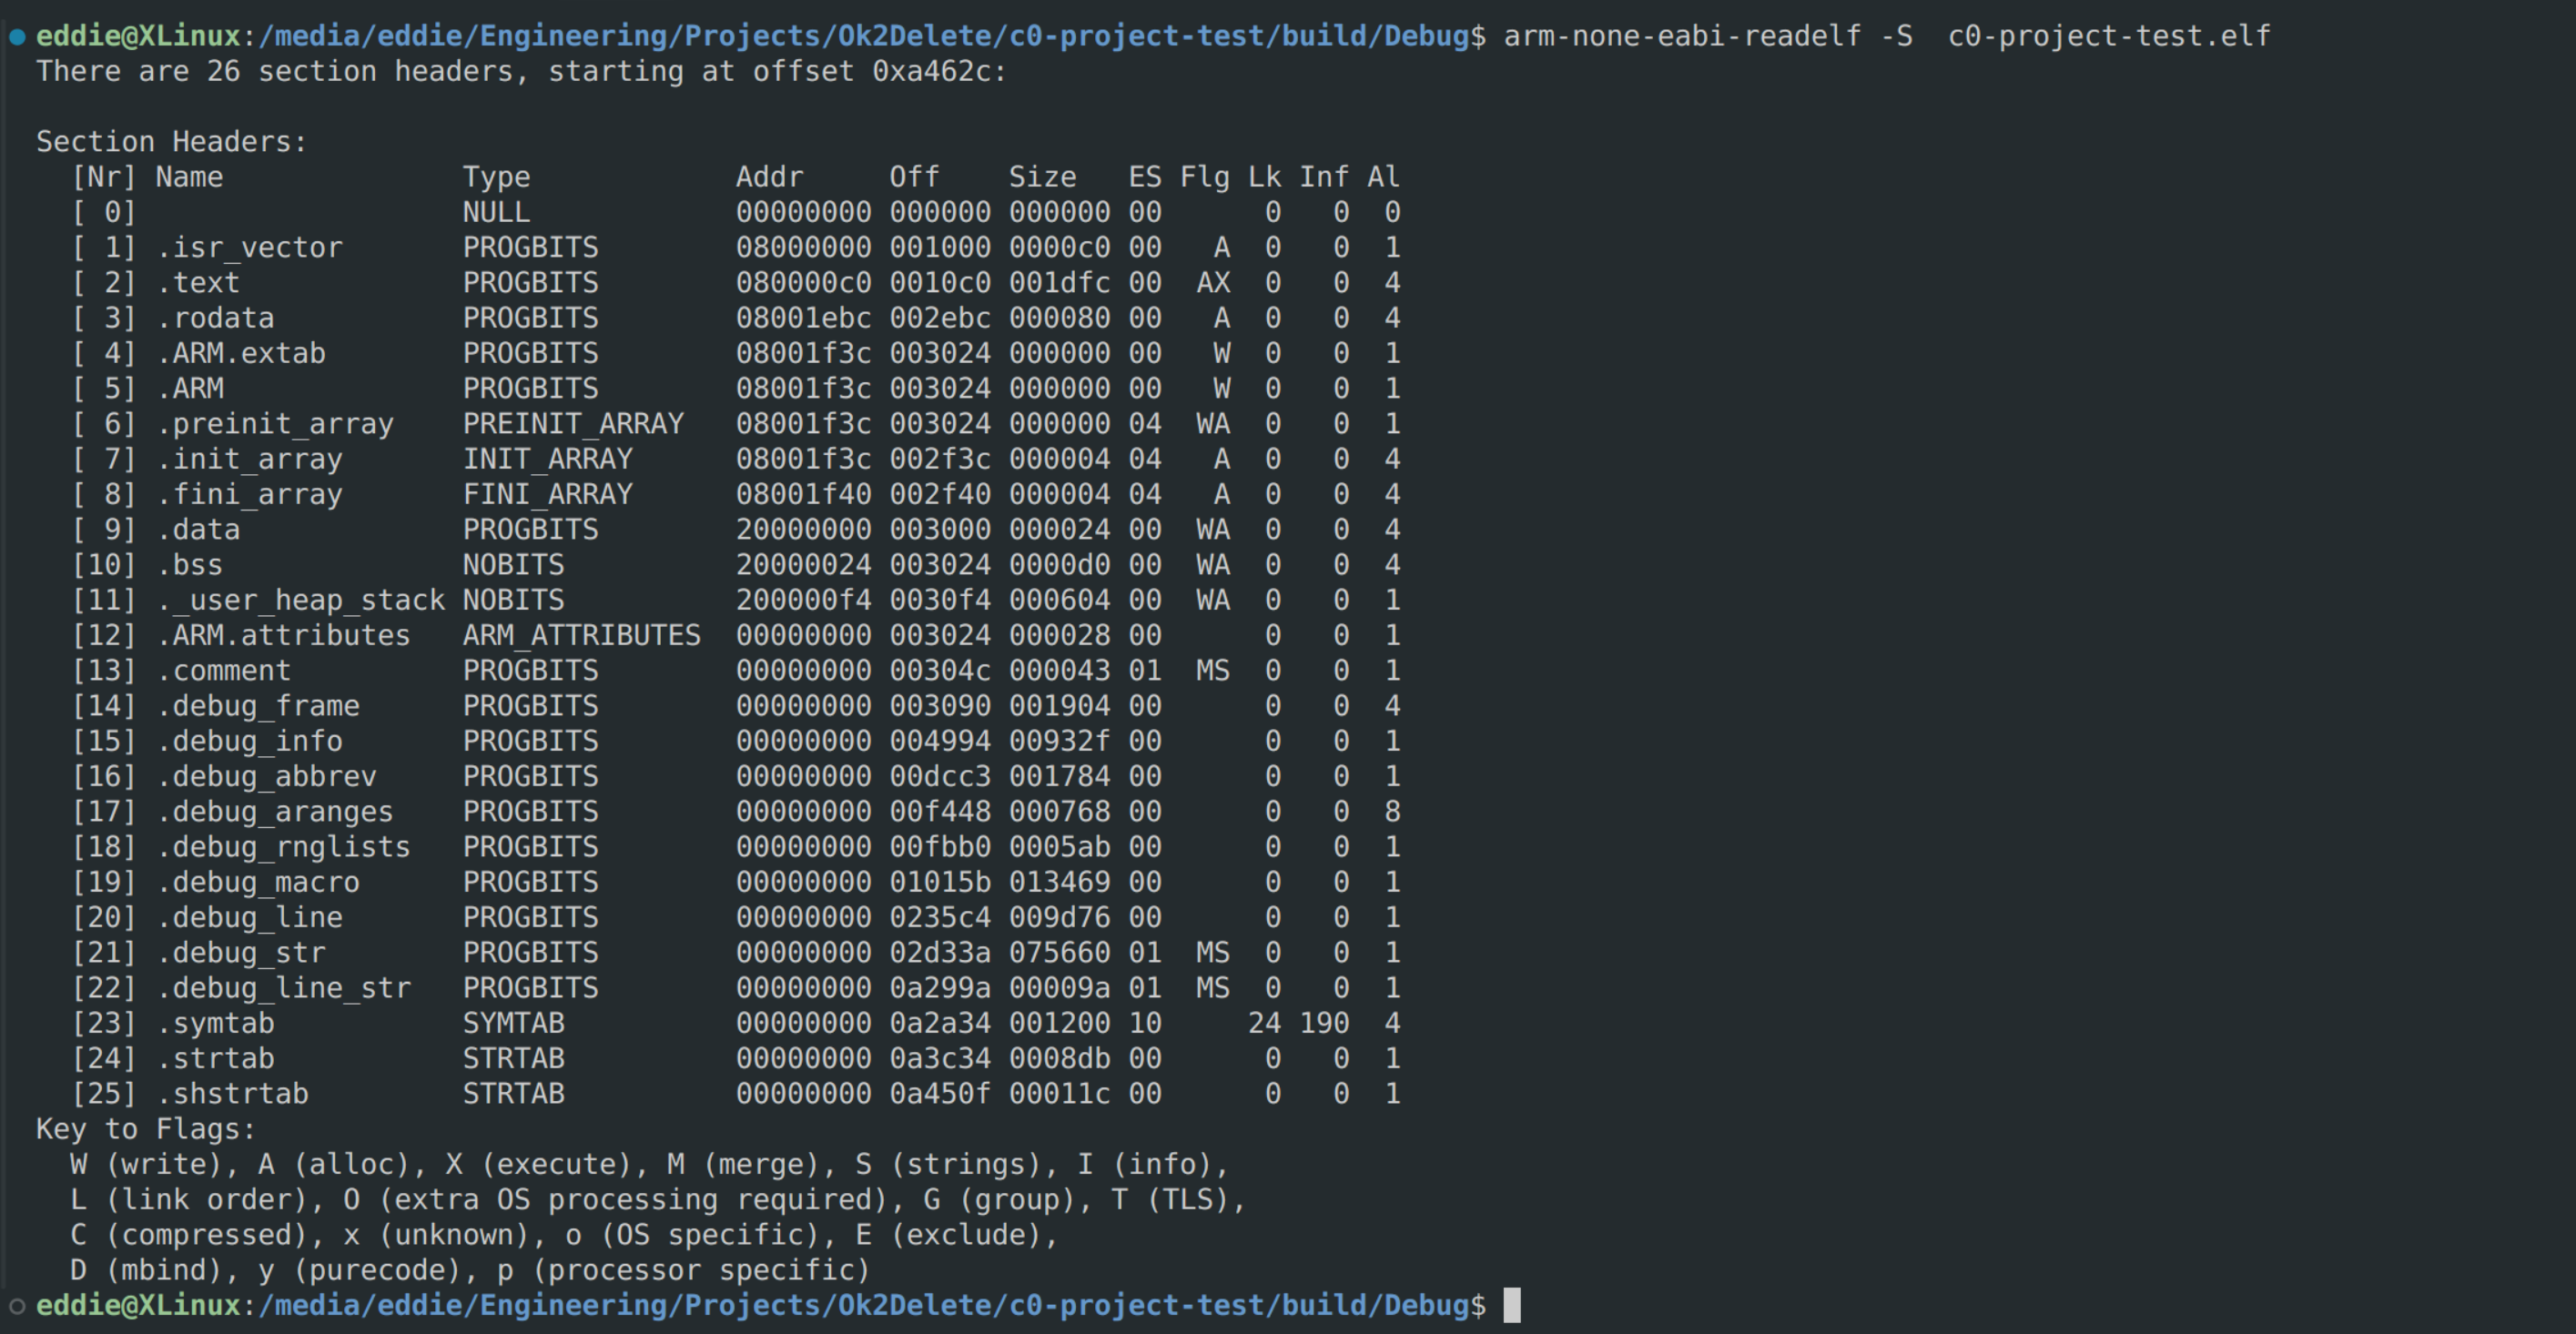
Section sizes was also thanks to an ARM GNU tool, I used arm-none-eabi-readelf to get the information I needed. This command practically does all the work for you.
It ouputs the section size already in a table format. I just had to parse the output and display it in my GUI.
A future enhancement that just occured to me would be to connect the symbol table to the call graph. This way, you could click on a function in the symbol table and see its connections in the call graph.
The Call Graph
Now the reason this extension is called ELFInsight is because I only make use of the ELF file. Could I have gotten the same information form the map file? Yes. However, to me the ultimate source of truth is the ELF file, it is what ultimately gets loaded into the microcontroller. The issue now is that the ELF file does not contain symbol table information in a format that is easy to parse. This presents a challenge when trying to visualize the relationships between functions in the call graph.
My approach was to use the objdump command to extract the disassembly of the ELF file. The disassembly contains the addresses of each instruction, which I can use to identify function calls and their targets.
async function getCallGraph(
    elfFilePath: string,
    functionNameToAddress: Map<string, string>,
    addressToFunctionName: Map<string, string>,
    functions: FunctionSymbol[]
): Promise<{ functionCalls: { [key: string]: string[] } }> {
    try {
        const objdumpOutput = await execCommandWithStream(objdumpCommand, ['-d', elfFilePath]);
        const functionCalls: { [key: string]: string[] } = {};
        let currentFunctionAddress = '';
        const lines = objdumpOutput.split('\n');

        for (const line of lines) {
            const functionMatch = line.match(/^([0-9a-f]+)\s+<([^\+>]+)>:/);
            if (functionMatch) {
                currentFunctionAddress = normalizeAddress(functionMatch[1]);
                const currentFunctionName = functionMatch[2];
                functionCalls[currentFunctionAddress] = [];

                // Add to addressToFunctionName if not present
                if (!addressToFunctionName.has(currentFunctionAddress)) {
                    addressToFunctionName.set(currentFunctionAddress, currentFunctionName);
                    functions.push({
                        address: currentFunctionAddress,
                        name: currentFunctionName
                    });
                }

                continue;
            }

            // Match direct and indirect calls
            const callMatch = line.match(/\s+(bl|blx|bx)\s+([^\s]+)/);
            if (callMatch && currentFunctionAddress) {
                const calledInstruction = callMatch[1];
                const calledOperand = callMatch[2];

                // If operand is a register, it's an indirect call
                if (/^r[0-9]+$/.test(calledOperand)) {
                    // Potential indirect call via register
                    // This requires data flow analysis to resolve, i dont have time for that, maybe later
                    console.warn(`Indirect call via register ${calledOperand} at function ${currentFunctionAddress}`);
                    continue;
                }

                let calledAddress = '';

                // Resolve the called function to its address
                const address = functionNameToAddress.get(calledOperand);
                if (address) {
                    calledAddress = normalizeAddress(address);
                } else if (/^[0-9a-f]+$/.test(calledOperand)) {
                    calledAddress = normalizeAddress(calledOperand);
                } else {
                    console.warn(`Unable to resolve called function ${calledOperand}`);
                    continue;
                }

                functionCalls[currentFunctionAddress].push(calledAddress);

                // If called function is not in addressToFunctionName, add it
                if (!addressToFunctionName.has(calledAddress)) {
                    addressToFunctionName.set(calledAddress, calledOperand);
                    functions.push({
                        address: calledAddress,
                        name: calledOperand
                    });
                }
            }
        }

        return { functionCalls };
    } catch (error) {
        return Promise.reject(error);
    }
}
The most important line in the above code is the one that matches the function calls.
const callMatch = line.match(/\s+(bl|blx|bx)\s+([^\s]+)/);
I use a regex to match the instruction and the operand. The operand can be either a register or an address. If it is a register, it is an indirect call.
I make use of a javascript library called cytoscape.js to visualize the call graph. This library is great for creating interactive graphs and has a lot of features that make it easy to work with.
This yields a messy looking graph like the one below:
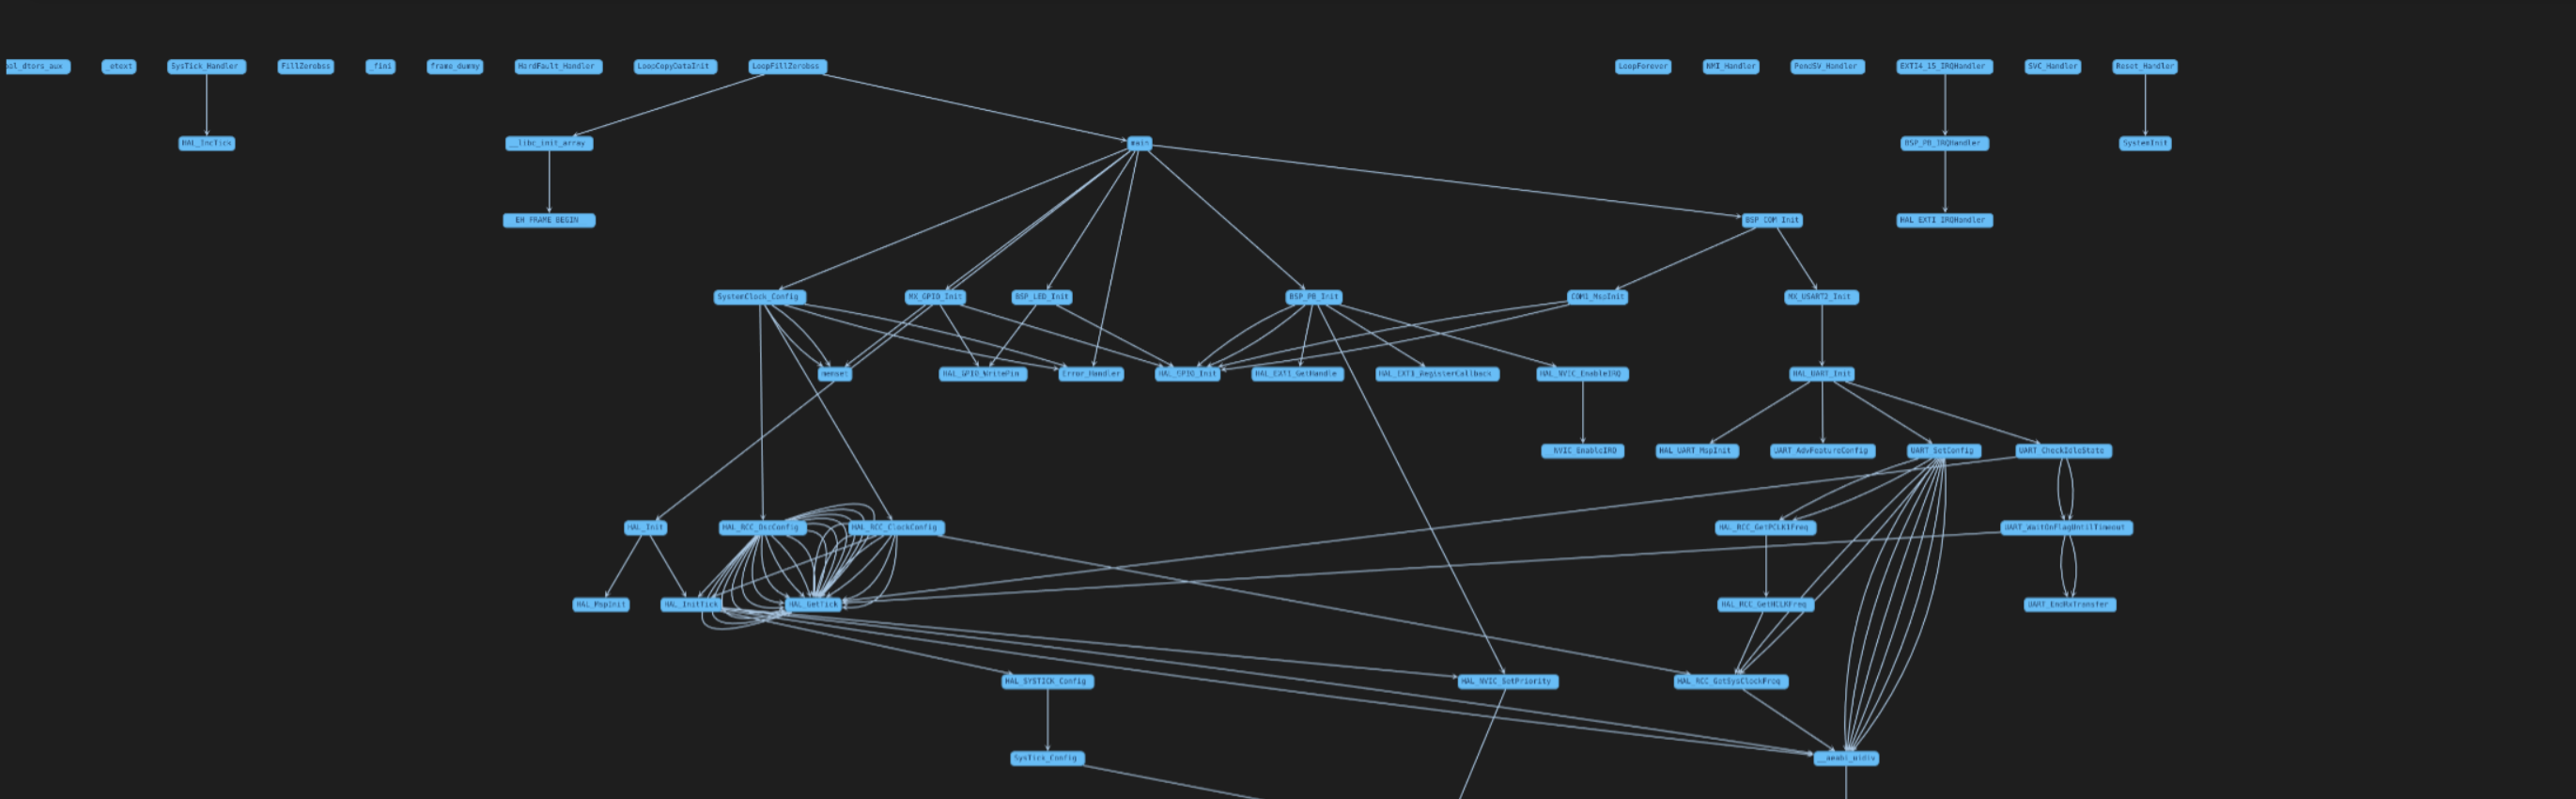
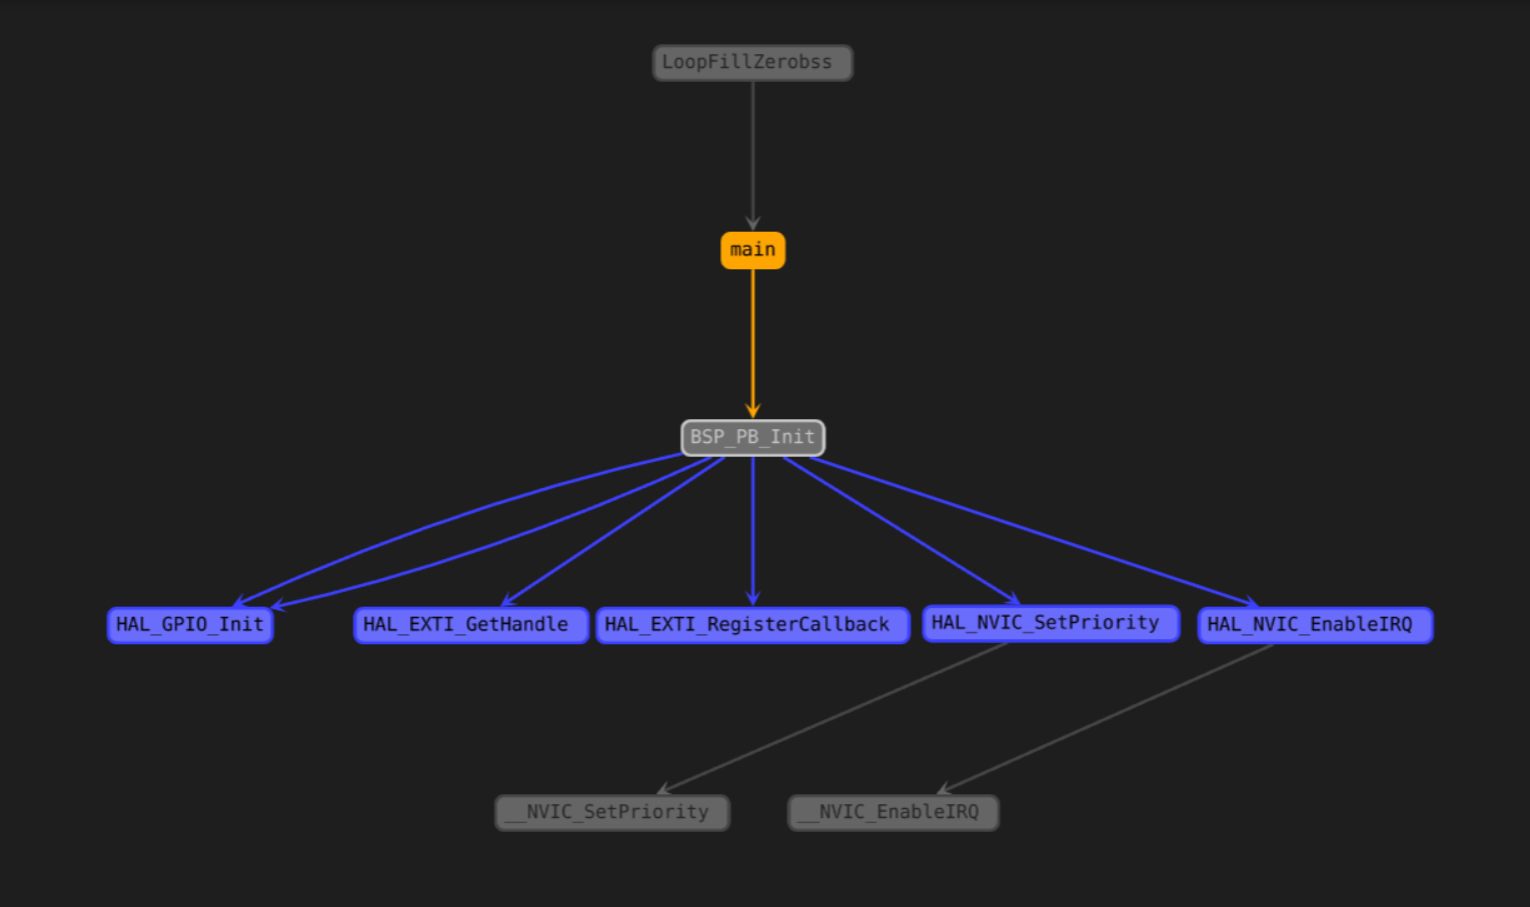
The nodes represent functions and the edges represent the calls between them. Clicking a node will higlight it with a given color, the callers another colors and the callees yet another color. And this if fine to get an overview of the graph and move around to explore the functions. However, I wanted something a little more organized and natural to interpret. I give the user the option to for an “Auto Stack” feature. Which arranged the graph in a more organized way. The selected node is centered and the callers and callees are arranged in a stack around it.
Currently the auto stack feature is hardcoded to 3 levels of depth. This means that the graph will only show the callers and callees of the selected node up to 3 levels deep each. There is no real reason for this, it is just a number I picked.
I will probably make this configurable in the future.
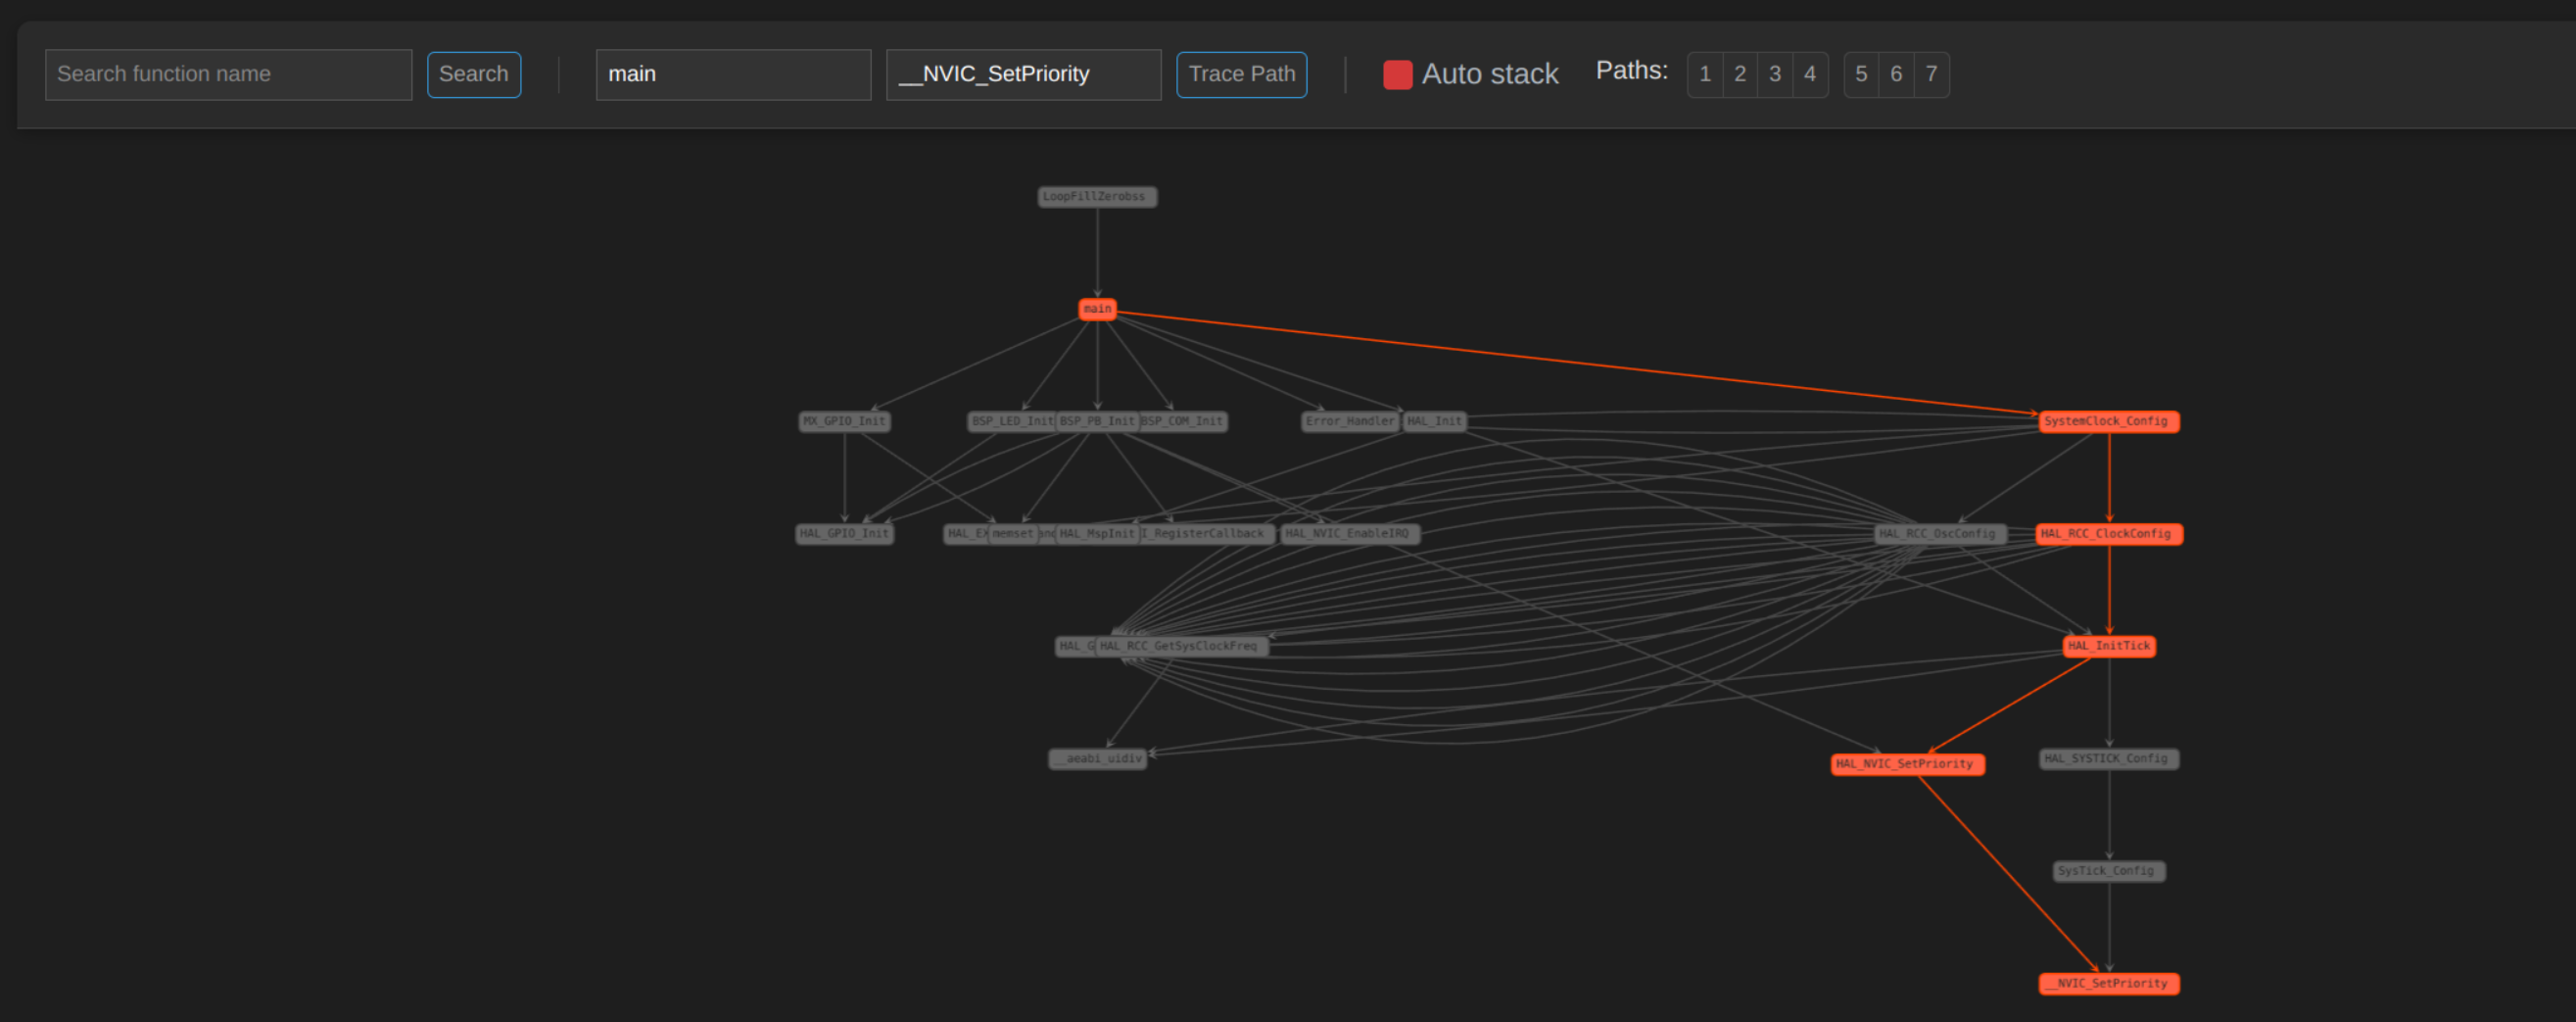
The graph has a path tracing feature. The means that you can give it a start and end node and it will find all paths paths between them. It will generate a button for each path found, highlighting the path in the graph while muting all other nodes. The path tracing also respect the auto stack feature. This means that if you have the auto stack feature enabled, the path will be shown in a stack format as seen below.
Overall I am very happy with the result. I actiavely udpate the extension and add new features. If you do find yourself downloading it and have any suggestions feel free to post it on the github issue page. https://github.com/EdwinFairchild/ELFInsight-VSCode